Gate Research: BTC Hits New Swing High, TSI Strategy Yields an Annualized Return of 119%
Introduction
This bi-weekly quantitative report (April 10–24) analyzes the market trends of Bitcoin and Ethereum using a range of indicators, including long-short ratio, open interest, and funding rates. It takes a deep dive into the True Strength Indicator (TSI), explaining its core principles, calculation logic, and how it can be applied to BTC trading strategies. Through extensive parameter optimization and backtesting, results show that the optimized TSI model excels at identifying market trend reversals and momentum strength. Its backtested returns and risk control metrics significantly outperform a simple buy-and-hold BTC strategy, making it a valuable quantitative tool for traders.
Abstract
- BTC price broke through to $94,000, while ETH surged to around $1,800, both showing strong upward momentum.
- Over the past two weeks, ETH has exhibited higher overall volatility compared to BTC, resulting in more pronounced price swings.
- The BTC long-short ratio climbed steadily after breaking through resistance, but dropped sharply on April 23, suggesting short-term profit-taking by market participants.
- BTC open interest has risen about 28% from its recent low, signaling growing bullish sentiment in the market.
- ETH funding rates dipped into negative territory multiple times, indicating that short sellers dominated during certain periods.
- With optimized parameters, the TSI strategy delivered an impressive annualized return of 119.75%.
Market Overview
1. Bitcoin & Ethereum Volatility Analysis
Over the past two weeks, Bitcoin mainly consolidated within the $81,000 to $85,000 range. Boosted by a weakening U.S. dollar and easing tariff tensions, BTC broke above key resistance on April 21, continued its upward momentum, and crossed the $90,000 mark, reaching a local high of around $94,000 on April 22. Since April 10, BTC has gained approximately 15%, with bullish momentum clearly dominating, effectively reclaiming the ground lost since February 25. In contrast, Ethereum’s performance was relatively weaker. It dipped multiple times during this period, but also rallied sharply between April 21 and 22, breaking past the previous resistance at $1,600 and climbing back above $1,800. ETH has risen about 12% since April 10.
Figure 1: BTC surged to $94,000, while ETH climbed above $1,800—both showing strength.
Over the past two weeks, the crypto market has largely remained in a consolidation phase, with volatility easing significantly compared to early April. During the initial period from April 10 to April 13, BTC briefly dipped below $80,000, causing intraday volatility to spike to as high as 0.0243. On the same day, ETH’s volatility surged even higher, nearing 0.043. This highlights Ethereum’s stronger short-term price swings and suggests more active trading and higher price sensitivity compared to BTC.
Between April 14 and April 20, overall market volatility eased, falling to relatively low levels. Both BTC and ETH volatility hovered around the 0.005 to 0.015 range, indicating a phase of market consolidation and more cautious sentiment among investors.
From April 21 to April 23, as BTC and ETH both broke through key price levels, market volatility surged significantly. This reflected heightened long-short battles and an uptick in trading activity. ETH volatility remained notably elevated during this period, once again peaking at 0.03—higher than BTC over the same timeframe—suggesting stronger investor engagement and more intense positioning on both sides of the trade. [1][2]
Figure 2: ETH’s volatility was consistently higher than BTC’s, indicating stronger price swings.
2. Bitcoin and Ethereum Long/Short Taker Size Ratio (LSR) Analysis
Between April 10 and April 12, BTC’s long-short ratio (LSR) surged to 1.09, reflecting a notable increase in bullish sentiment among traders. However, from April 13 to 17, the ratio pulled back and entered a consolidation phase, signaling a market adjustment where buying and selling pressure became more balanced, and overall sentiment turned cautious. After April 18, the LSR began to climb again, reaching a local high of 1.13 on April 21–22, indicating a renewed bullish outlook among investors. The sharp decline that followed, however, suggests short-term profit-taking or risk-off behavior from some traders after intense price movement, highlighting concerns over the sustainability of the rally.
From April 10 to 12, ETH’s LSR also climbed quickly, peaking at 1.06, indicating bullish dominance and growing investor optimism during that period. But from April 13 to 16, the ratio saw a significant drop, reflecting a cooling of sentiment and a brief consolidation as bullish strength faded. Then, between April 17 and 19, the LSR spiked again to 1.08, showing renewed buying momentum and a return to bullish positioning. However, the ratio once again dipped quickly on April 20–21, revealing heightened volatility and unclear market direction. Traders became more short-term focused, with many adopting a wait-and-see approach. By April 22–23, as ETH prices broke out, the LSR bounced back to 1.07 after a brief pullback, signaling a more optimistic sentiment shift toward long positions post-breakout.
Overall, LSR trends for both BTC and ETH show strong correlation with price movements. BTC saw more sustained bullish positioning and stronger sentiment, while ETH experienced more back-and-forth between bulls and bears, pointing to a more cautious market stance.[3]
Figure 3: BTC’s long-short ratio steadily climbed after breaking the $85,000 resistance, but dropped sharply on April 23.
Figure 4: ETH showed weaker bullish liquidity, with bearish sentiment comparatively stronger than BTC.
3. Open Interest Analysis
According to CoinGlass data, BTC open interest rose to a local high of $58.9 billion after April 10, before pulling back to a low of $52.4 billion. After April 21, as BTC prices gained momentum, open interest surged again, reaching as high as $67.1 billion, approximately 28% increase from the recent low. This rebound suggests a recovery in investor confidence and a noticeable uptick in trading activity.
During the same period, ETH open interest remained relatively stable within the $17–18.5 billion range. As ETH prices climbed, open interest also rose in tandem, reaching a peak of $21.2 billion. This trend reflects an increase in market risk appetite among investors.[4]
Figure 5: BTC open interest rebounded about 28% from its low, indicating stronger bullish trading sentiment.
4. Funding Rates Analysis
Between April 10 and April 12, both BTC and ETH funding rates fell into negative territory multiple times. It is a typical signal that the market was short-dominated in the short term, with cautious investor sentiment prevailing.
From April 13 to April 16, funding rates for both assets turned positive, reaching local highs. For instance, BTC hit a peak funding rate of 0.0077% on April 14, while ETH peaked at 0.0062% on April 15. This shift indicates a stronger bullish mood during this period, with long positions taking the upper hand.
Between April 17 and April 20, funding rates fluctuated frequently between positive and negative values. The divergence between BTC and ETH funding rates widened, suggesting growing short-term disagreement among traders and a lack of clear market direction amid intensified long-short battles.
The most extreme fluctuations occurred from April 21 to April 23. On April 21, BTC’s funding rate sharply dropped to -0.0194% and -0.0186%, then hit a short-term low of -0.0271% at 16:00 on April 22 before gradually recovering. This period saw intense market volatility with strong bearish sentiment dominating before returning to a more balanced state. ETH funding rates exhibited sharp swings, dropping to -0.0083% on April 21 (08:00) and reaching a low of -0.0122% on April 23 (00:00), indicating significant selling pressure. While bears were in control briefly, the recovery was relatively swift.
Over the past two weeks, funding rates for both BTC and ETH have experienced frequent and dramatic swings, highlighting fierce long-short contention and the absence of a clear, sustained market consensus. Notably, sentiment volatility peaked from April 21 to 23. These intense fluctuations in the funding rate suggest that short-term speculative behavior dominates the market. The rapid shifts in positioning indicate that short-term capital is quick to chase momentum, especially during price breakouts, while a stable directional bias remains elusive.[5][6]
Figure 6: ETH funding rates dipped into negative territory multiple times, indicating that short sellers were in control during certain periods.
5. Cryptocurrency Contract Liquidation Trends
According to data from Coinglass, since April 10, liquidation volumes in the crypto derivatives market have narrowed significantly compared to early April. As of April 21, the daily average liquidation amount across the market was approximately $216 million. This suggests that market volatility had eased and that investors were exercising greater risk control.
However, following the strong breakout and rapid price surge in the crypto market after April 21, heightened volatility triggered a wave of short liquidations. On April 22, the total amount of short liquidations across the market spiked sharply, reaching $517 million. This surge reflects a short squeeze effect, where many short positions were forcibly closed due to aggressive price movement. It also highlights how rapidly trading sentiment can shift during major price rallies, with conflicting views on short-term direction leading to a dramatic increase in liquidations.[7]
Figure 7: On April 22, total short liquidations across the crypto market reached $517 million.
Quantitative Analysis - The TSI Indicator: Capturing Trend Reversals and Momentum with Precision
(Disclaimer: All forecasts in this article are based on historical data and market trends. They are for reference only and should not be considered investment advice or guarantees of future market performance. Investors should fully assess risks and make cautious decisions when engaging in related investments.)
1. Overview of the Indicator
The True Strength Index (TSI), developed by William Blau, is a type of oscillator that smooths price momentum to help traders identify trend direction, strength, and potential overbought or oversold conditions. TSI is particularly effective in highlighting trend reversals, confirming momentum signals, and spotting divergences, making it a popular tool in trend-following and momentum-based trading strategies.
2. Core Calculation Logic
The TSI is calculated through the following steps:
1.Calculate price momentum (Momentum):
Momentum = Current closing price − Previous closing price
2.Apply double exponential smoothing (EMA) to the momentum values, typically using common periods of 25 days (slow line) and 13 days (fast line):
EMA1 = EMA(momentum, fast period 13), EMA2 = EMA(EMA1, slow period 25)
3.Apply double EMA to the absolute momentum values:
Absolute momentum = |Current closing price − Previous closing price| \
EMA3 = EMA(absolute momentum, fast period 13), EMA4 = EMA(EMA3, slow period 25)
4.Final TSI value is computed as:
TSI = (EMA2 / EMA4) × 100
This method allows the TSI to smooth out short-term fluctuations in price momentum while clearly reflecting the overall trend direction and helping to identify overbought or oversold market conditions.
3. Trading Strategy Application
Trading Logic:
- Buy Signal: Triggered when the TSI crosses above the set threshold from below.
- Sell Signal: Triggered when the TSI crosses below the set threshold from above.
The threshold refers to a critical level (either minimum or maximum) at which a signal or effect becomes significant.
Strategy Parameter Overview:
To enhance the usability and flexibility of the TSI calculation, the strategy employs the following three core parameters:
- mDay (Fast Line Period): This is the EMA smoothing period applied to raw momentum, typically set to 13 days. It determines how quickly the TSI responds to price changes. A smaller mDay makes the TSI more sensitive to price fluctuations, while a larger mDay smooths out the noise.
- nDay (Slow Line Period): This is the EMA period applied to the already-smoothed momentum, typically set to 25 days. It controls how the TSI reacts to longer-term trends. A larger nDay results in a smoother and more stable TSI curve, while a smaller nDay increases curve volatility.
- threshold (Signal Trigger Level): This defines the overbought and oversold thresholds for TSI, generally set to ±25. A TSI reading above +threshold signals potential overbought conditions, while a reading below –threshold indicates oversold conditions. This value can be adjusted depending on market conditions or asset characteristics. A higher threshold yields fewer but higher-quality signals, while a lower threshold produces more frequent but potentially noisier signals.
Trading Example:
Let’s take BTC as an example, with parameters set to (mDay = 13, nDay = 25, threshold = 25):
- Signal Triggered:
At 22:00 on April 20, 2025 (UTC+8), during the 15-minute K-line interval, Bitcoin’s True Strength Index (TSI) crossed upward through the –25 threshold. According to our strategy settings, this serves as a clear buy signal.

- Action and Outcome:
After confirming the trend, the investor enters a buy trade on the following candle. BTC subsequently enters an upward move, and the position is exited when the TSI crosses downward through the +25 threshold. The total price increase during this swing was 3.36%, demonstrating the effectiveness of the TSI-based signal in this case.

This example illustrates how to apply the TSI strategy using the three core parameters: mDay, nDay, and threshold. \
Here, mDay and nDay correspond to short-term and long-term EMA smoothing periods, respectively. By adjusting the combination of these values, traders can fine-tune the TSI’s sensitivity to suit various levels of market volatility. The threshold parameter (e.g., –25 and +25) defines the entry and exit zones, helping traders identify overbought and oversold conditions more clearly.
With appropriate parameter settings, the strategy can not only capture potential trend reversals but also filter out false signals during sideways or choppy markets. This enhances both the robustness and win rate of the trading system. The live case above is a prime example of how proper parameter tuning can significantly impact strategy performance.
In the next section, we’ll evaluate how different parameter combinations perform across market conditions to identify the settings that deliver the best cumulative returns.
4. Parameter Optimization and Backtesting Validation
This strategy is built around the True Strength Index (TSI), which identifies trend reversals by tracking changes in momentum. By applying double exponential smoothing to price changes, TSI effectively filters out market noise while generating smoother and more representative momentum signals. We conducted systematic optimization and backtesting on its three core parameters:
- mDay: The short-term EMA period, used to capture recent price momentum.
- nDay: The long-term EMA period, used to smooth out the overall trend.
- threshold: The decision level for entry and exit signals, typically set at ±25 to capture overbought and oversold zones.
Backtesting was performed using 15-minute candlestick data for the BTC_USDT trading pair, covering the period from April 22, 2024, to April 22, 2025. Transaction costs, such as fees, were not included in this test. To maintain consistency in trading logic, trades were executed on the candle immediately following a signal, and existing positions were closed and reversed when an opposite signal occurred.
Backtest Parameter Configuration
To identify the optimal parameter combination, we carried out a systematic grid search across the following ranges:
- mDay: 1 to 50 (step size = 50)
- nDay: 1 to 50 (step size = 50), with the condition that mDay < nDay
- threshold: 10 to 30 (step size = 20)
In total, 50,000 parameter combinations were tested. From this set, we selected the top five parameter sets based on cumulative returns and evaluated them using key metrics, including annualized return, Sharpe ratio, maximum drawdown, and Calmar ratio.

Chart: Comparison of Cumulative Returns for Top 5 Parameter Sets on Bitcoin’s 15-Minute Interval Since April 22, 2024
Chart: Distribution of Annualized Returns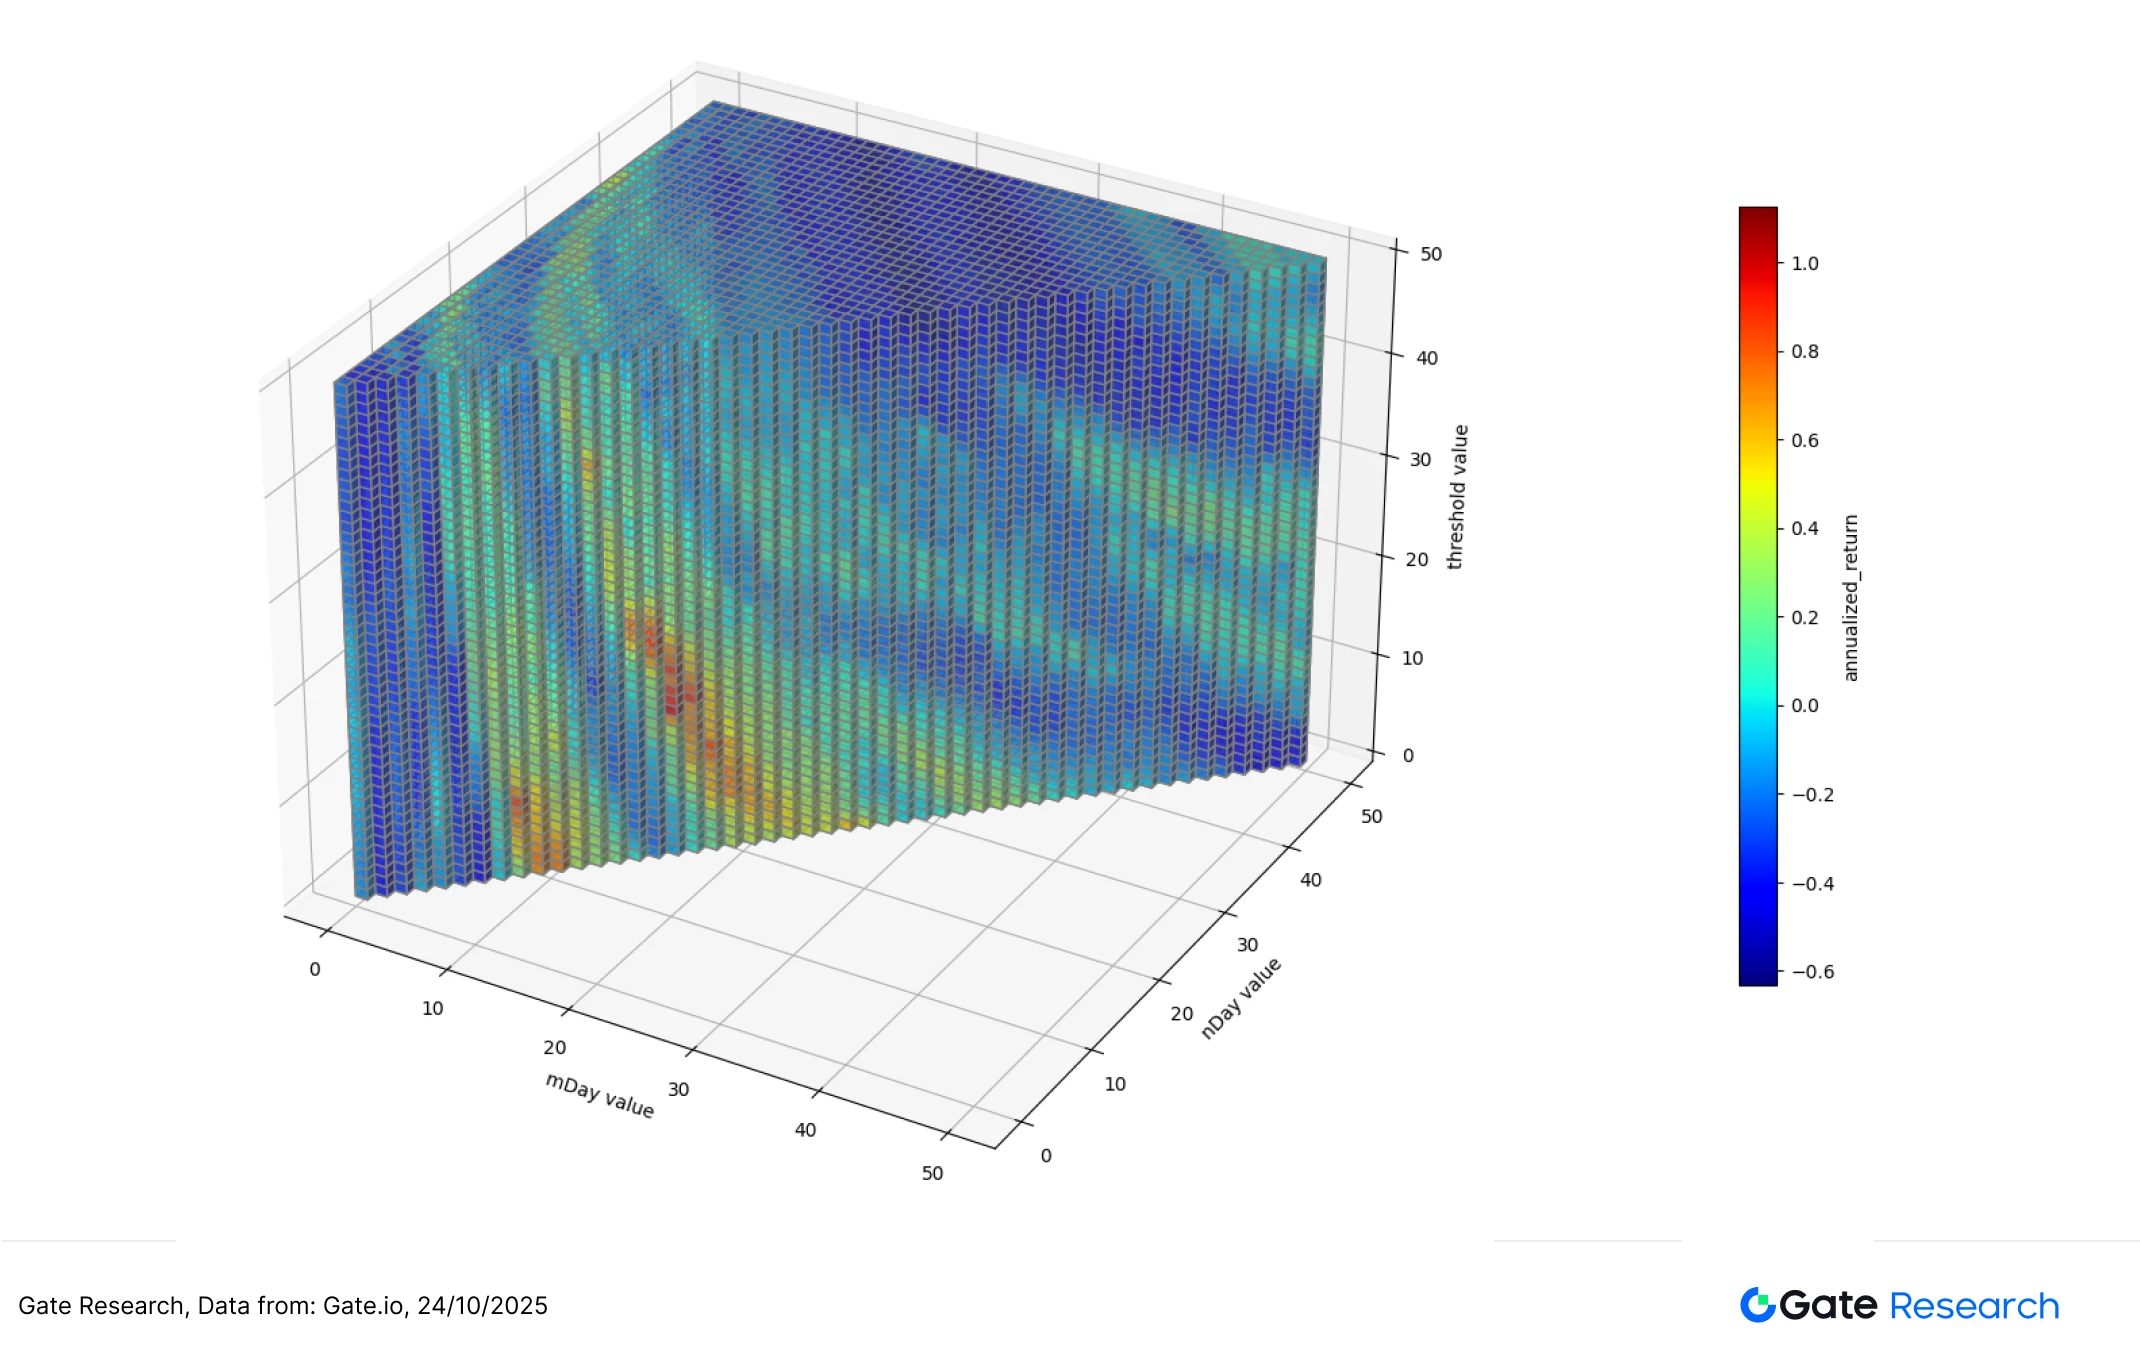
Chart: Distribution of Sharpe Ratios
Parameter combinations with medium-short term settings (where mDay and nDay fall between 10 and 30) and lower trading thresholds (around 10 to 20) demonstrated significantly better returns.
On the other hand, using longer periods (with mDay and nDay above 40) or excessively high thresholds (above 40 or 50) generally led to weaker performance. These results suggest that overly large parameter values may struggle to keep pace with market fluctuations.
5. Trading Strategy Summary
This strategy utilizes the True Strength Index (TSI) to guide trading decisions, effectively capturing trend reversals by tracking momentum changes. After initial testing and parameter optimization, it demonstrated strong performance. By applying double exponential smoothing, TSI filters out short-term market noise, thereby enhancing the clarity of trend signals.
We conducted a comprehensive backtest using 15-minute interval data for BTC_USDT, covering the period from April 22, 2024, to April 22, 2025. Three key parameters of TSI were optimized: the short-term EMA period (mDay), long-term EMA period (nDay), and signal threshold (threshold). A total of 50,000 parameter combinations were tested, and the top five performers were selected for deeper performance analysis.
The top five configurations consistently outperformed. Most of these fell within the ranges of mDay = 5–7, nDay = 16–21, and threshold= 10–16. These strategies delivered average cumulative returns of approximately 118%–120%, significantly outperforming the simple BTC buy-and-hold strategy over the same period (which yielded ~43.58%). They also demonstrated stronger risk metrics—maximum drawdowns of only 19.19%–27.12%, Sharpe ratios between 2.25–2.30, and Calmar ratios between 4.36–6.22, highlighting the strategy’s robust risk control and superior performance compared to passive BTC holding.
Additionally, parameter trend analysis clearly shows that combinations of shorter EMA periods and lower threshold levels are better at capturing decisive market trends, yielding higher and more stable excess returns. In contrast, overly long EMAs or high thresholds led to deteriorated performance, likely due to missed opportunities caused by delayed signal response. This suggests the strategy’s effectiveness depends in part on momentum conditions and the frequency of trend shifts in the market.
Overall, through this systematic empirical validation and 3D parameter space analysis, we confirm that the TSI-based strategy is highly effective for capturing short-term BTC trends. It exhibits strong practical potential and, with proper parameter tuning, achieves greater stability and profitability. For future deployment or further refinement, we recommend focusing on the parameter ranges of mDay= 5–7, nDay = 16–21, and threshold= 10–16, where the strategy consistently demonstrates robust performance.
Conclusion
This report provides an in-depth analysis of BTC and ETH market performance from April 10 to April 24. After breaking through key price levels, both assets saw a clear rise in bullish momentum and renewed buying interest. However, this was accompanied by heightened short-term volatility and intense long-short sentiment battles. Metrics such as open interest, long/short taker size ratios, and funding rates effectively reflected shifts in market sentiment and risk appetite.
Furthermore, our performance testing and parameter optimization of the True Strength Index (TSI) demonstrated its effectiveness in identifying trend reversals and momentum shifts. Through historical backtesting and systematic parameter analysis, we identified an optimal parameter range (mDay: 5–7, nDay: 16–21, threshold: 10–16). Using these parameters, the TSI-based strategy substantially outperformed a simple BTC buy-and-hold approach, generating consistent annual returns while maintaining strong risk control.
References:
- Gate.io, https://www.gate.io/trade/BTC_USDT
- Gate.io, https://www.gate.io/trade/ETH_USDT
- Coinglass, https://www.coinglass.com/LongShortRatio
- Coinglass, https://www.coinglass.com/BitcoinOpenInterest?utm_source=chatgpt.com
- Gate.io, https://www.gate.io/futures_market_info/BTC_USD/capital_rate_history
- Gate.io, https://www.gate.io/futures/introduction/funding-rate-history?from=USDT-M&contract=ETH_USDT
- Coinglass, https://www.coinglass.com/pro/futures/Liquidations
Gate Research
Gate Research is a comprehensive blockchain and crypto research platform, providing readers with in-depth content, including technical analysis, hot insights, market reviews, industry research, trend forecasts, and macroeconomic policy analysis.
Disclaimer
Investing in the cryptocurrency market involves high risk, and it is recommended that users conduct independent research and fully understand the nature of the assets and products they are purchasing before making any investment decisions. Gate.io is not responsible for any losses or damages caused by such investment decisions.
Related Articles

Gate Research: BTC Breaks $100K Milestone, November Crypto Trading Volume Exceeds $10 Trillion For First Time

Gate Research: 2024 Cryptocurrency Market Review and 2025 Trend Forecast

Gate Research-A Study on the Correlation Between Memecoin and Bitcoin Prices

Gate Research: Web3 Industry Funding Report - November 2024

Perpetual Contract Funding Rate Arbitrage Strategy in 2025
